Lately I’ve been working on a project to explore the x86-64 instruction set. Part of this exploration requires using a disassembler to get the actual instructions that comprise a piece of software. That leads to the question “Where exactly are the instructions that make up my program? “
Let’s say you have a program written in C like the following
#include<stdio.h>


int main() {
 printf("Hello World!\n");
 return 0;
}
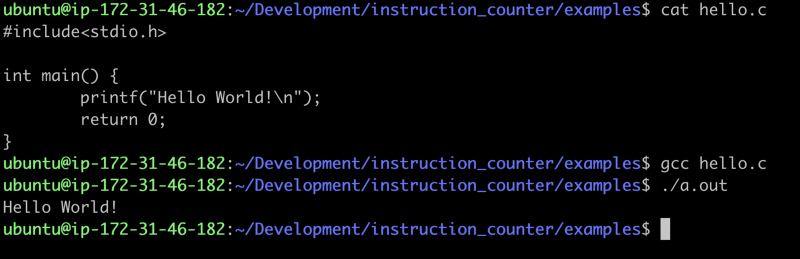 Print the program, compile it, run it.
The first leading question is: what exactly is a.out anyway? In most
circles you’ll hear it called a binary but that’s not the whole picture.
Specifically, it’s an Executable & Linkable Format file also called an elf
file. Amazing write-ups exist on the structure of this file so if you want to
learn all the nitty gritty details I’d highly suggest the wiki page.
Executable and Linkable Format - Wikipedia
_In computing, the Executable and Linkable Format ( ELF, formerly named
Extensible Linking Format), is a common standard
…_en.wikipedia.org
For our purposes the important thing to know is that the file contains a very
informative program header with all the physical offsets to physically locate
the bits we care about. The main part of our program lives within a section
called .text.
There’s a few different ways to find the physical offset and size of the text
section. One way is to use the readelf util.
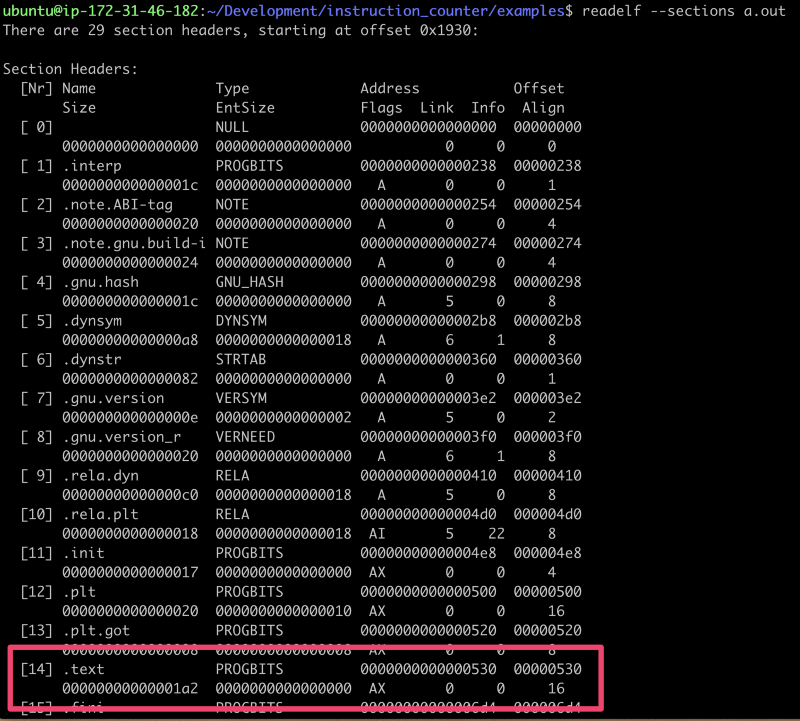 readelf output of the sections in a.out
Here we can see that offset for .text is 0x530 with a size of 0x1a2. This,
however, includes all the instructions that the compiler designated as our
program. It includes a lot of additional boilerplate to setup the environment
and stack that executes before main. If we wanted the opcodes for just main we
would need to look inside the symbol table to find the specific symbol’s
offset and size. One way to get that information is to use objdump.
 objdump output of the symbol main
Here we can see that main is defined in the .text section with offset 0x63a
and with size 0x17.
We can use a different trick with gdb to confirm these offsets and lengths
are correct. Here’s an example using gdb to disassemble a particular symbol
so we can see the individual instructions.
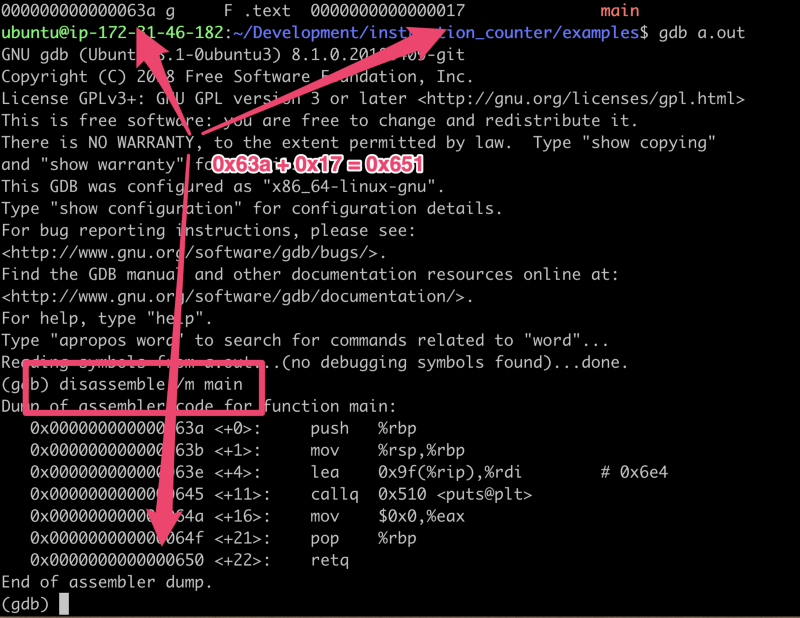 gdb confirming the offsets
As an interesting side note we can look at the 3rd instruction lea (which is
‘load effective address’ if you aren’t used to reading assembly). This is
going to load the effective address of 0x9f+%rip (%rip is a register) which
gdb says is 0x6e4 via the comment on the right. If we return to the same
utility objdump we used above we can get the data section of the file we can
confirm that’s the address of “Hello World!”
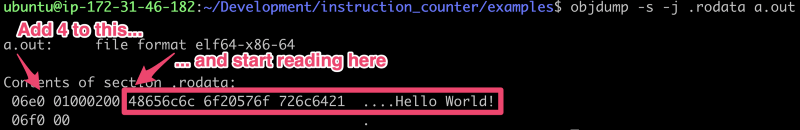 objdump output of the .rodata section