There’s debugging and there’s debugging. This is a story of the latter. Before we get into this jaunt I’d like to add that I’ve written this piece to mimic how we actually got to the conclusion. If you’re experienced in strange stuff you might see a faster route or use a different tool. There’s more than one way to do most of this and this was what I had at hand when I needed it.
All stories start somewhere
Some background first. I’m currently working in a bioinformatics lab that works on the functional identification of proteins. One of our projects requires that we benchmark against an older tool that performs a similar function. I’m not going to throw the particular tool under the bus, but needless to say, it’s charming in a way that only academic software can be.
- Documentation ranges from “poor” to “nonexistent.”
- It’s held together with an unholy amalgamation of Perl, awk, tsch, and yes, Fortran.
- It includes/distributes binaries to other programs that the internet has forgotten.
- Some of the copyright headers are from when I was in elementary school- others before even that.
So… “charming.” A web-based version is available but is limited to how many proteins you can submit (via cgi-bin!) within a 24 hour window (it’s a low number- say ~100) and we need to process well over 100k. So the naive, innocent question that started this was:
“Well, can we run it locally?”
After all, all the pieces are available for download so it would seem simple enough, right? You can probably already surmise the answer since you’re reading an article called “extreme debugging.”
I’m going to focus on a small pieces of a much larger puzzle called netNGlyc.
This handy, dandy little program is used to predict N-glycosylation sites in proteins.
It’s distributed as a tarball.
Easy enough!
We can unpack it, and then perform setup by editing its main file netNglyc (written in tsch) by specifying the path to the unpacked dir.
Easy peazy.
And then we run the quick test and…
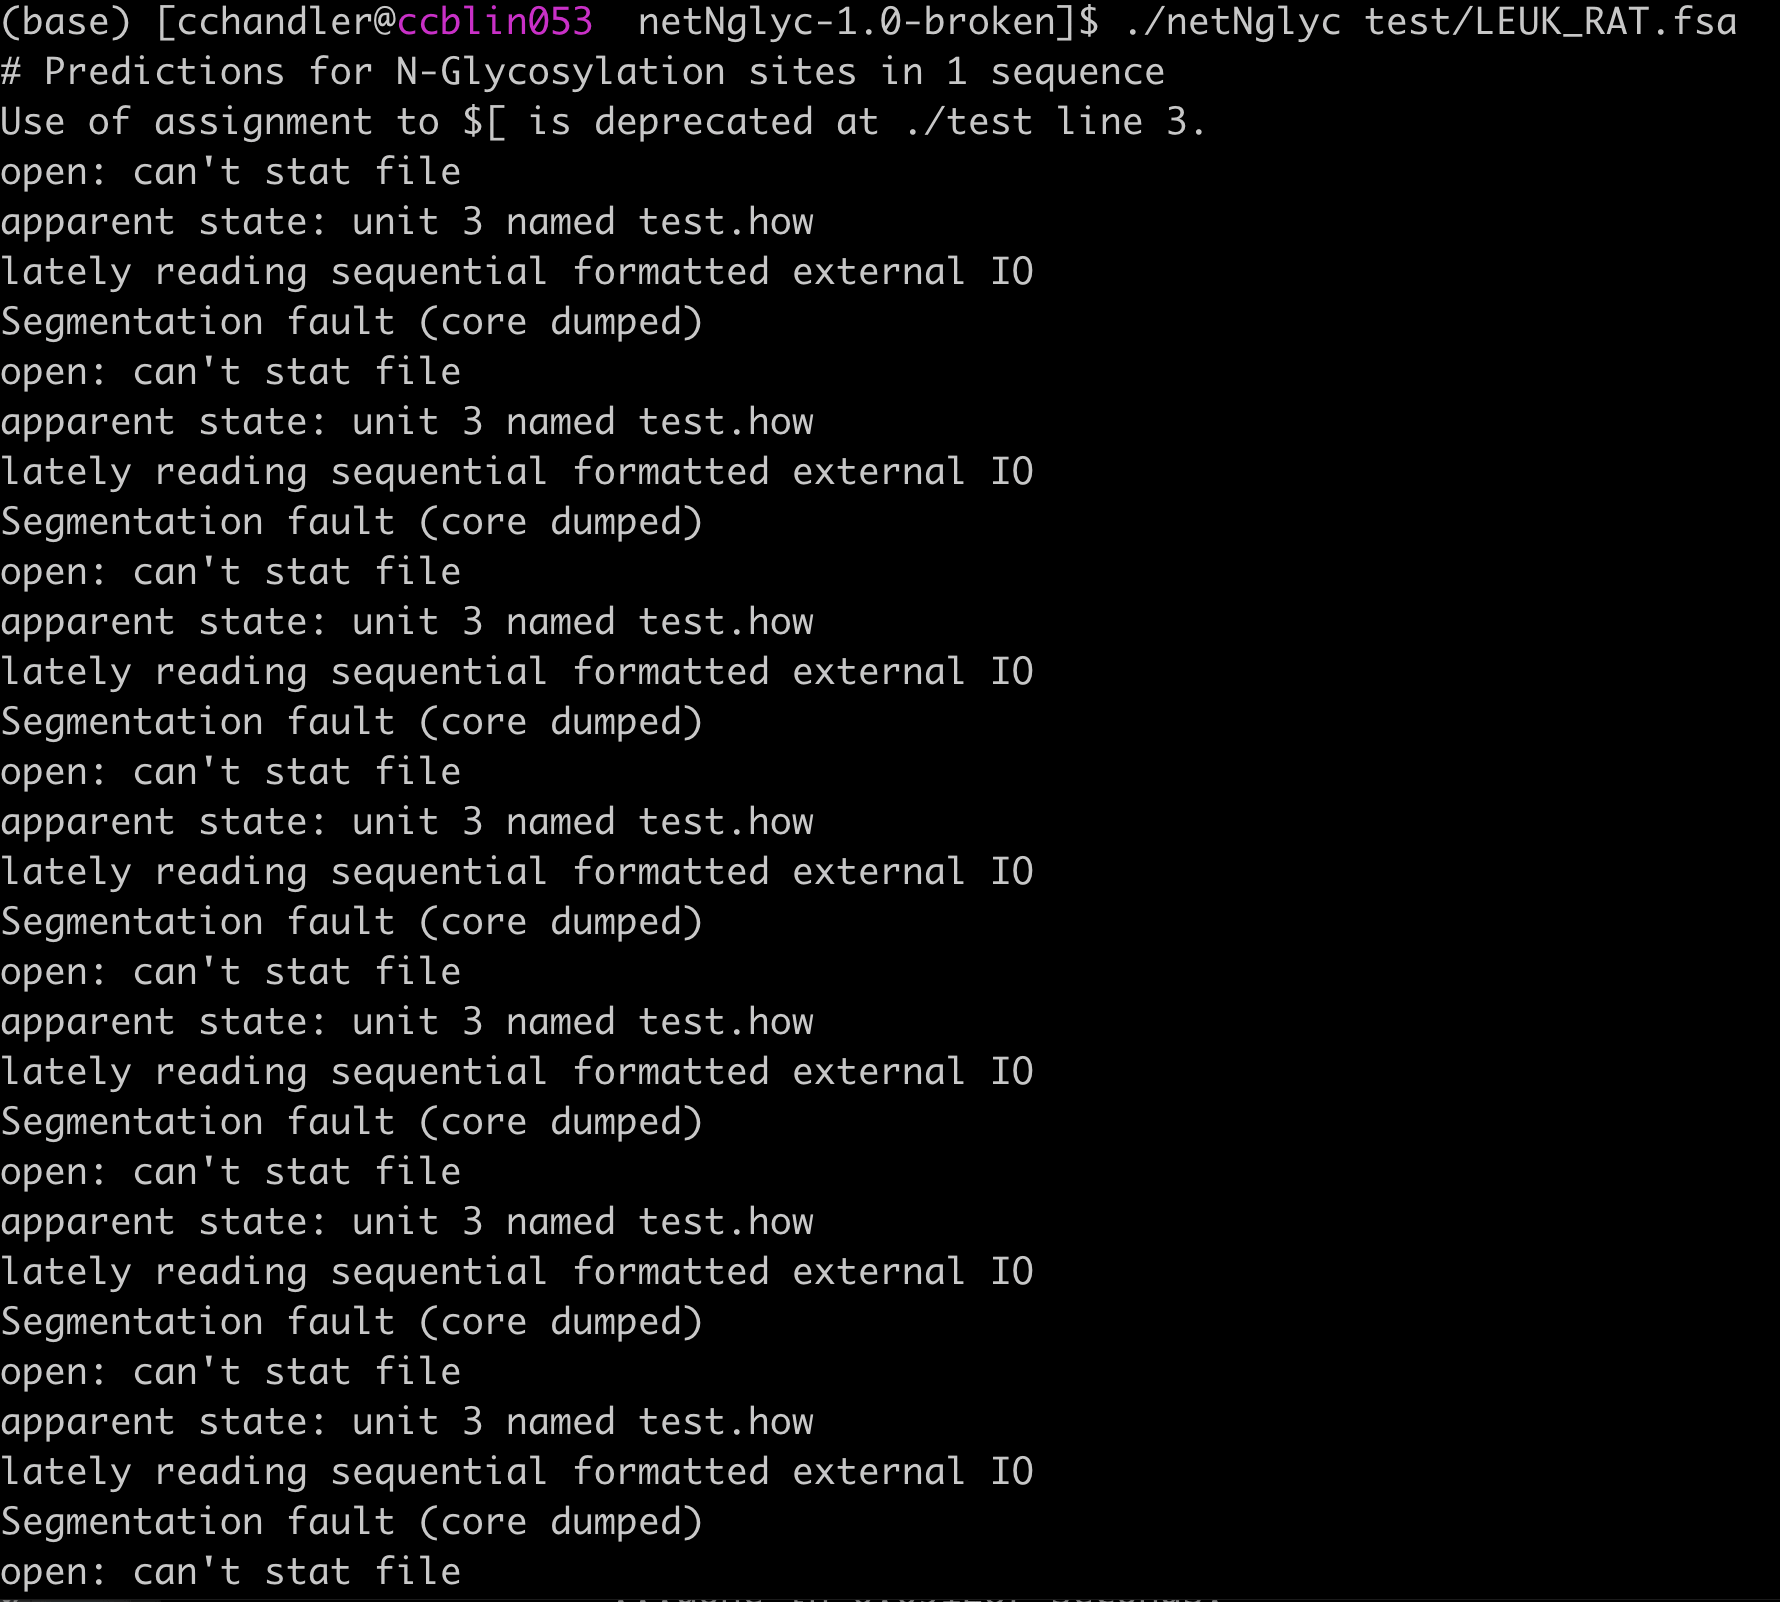 All the segfaults
What process is actually segfaulting?
The entry point into this program is a tsch script that calls numerous additional awk and tsch files.
We have a few options we can try.
If kernel logging is enabled, then dmesg logs might include the offender like the following.
[30590535.213144] how98_Linux[1560171]: segfault at 8000000 ip 00000000080744f7 sp 00000000ffb8a114 error 4 in how98_Linux[8048000+5a000]
A second option, assuming dmesg doesn’t include this or doesn’t help, is to use strace.
If you don’t have much experience with strace and you work on Linux frequently, it’s very much worth your while to learn this tool.
We’re going to use it with -f for “follow process forking” so we can see everything that ends up being called.
We’re also invoking it with -o so we can write the output to a file and go through it.
strace -f -o /tmp/debugging ./netNglyc test/LEUK_RAT.fsa
And then look through the output:
grep SIGSEGV /tmp/debugging
Looking for SIGSEGV will show us everywhere a segfault signal was handled.
We’ll hopefully see lines like the following, where the left-most integer is the PID of the process.
1560785 +++ killed by SIGSEGV (core dumped) +++
Now we can grep for both the PID and the execve syscall1 to see what program was launched.
grep 1560785 /tmp/debugging | grep exec
Lo and behold:
1560785 execve("/mnt/home/cchandler/ceph/Programs/netNglyc-1.0-broken/how/how98_Linux", ["/mnt/home/cchandler/ceph/Program"...], [/* 89 vars */]) = 0
Exploring the target
We have our culprit.
It’s whatever how98_Linux is.
First question: what exactly is it?
$ file how98_Linux
how98_Linux: ELF 32-bit LSB executable, Intel 80386, version 1 (SYSV), statically linked, for GNU/Linux 2.0.0, stripped
Oh. So the thing crashing is an old statically linked binary that’s been fully stripped2.
A quick run of nm will confirm the awful truth and yield the same result.
$nm how98_Linux
nm: how98_Linux: no symbols
So let’s quickly recap what we learned:
- We have a 32-bit ELF binary
- Statically linked with glibc
- Against Linux ABI 2.0.0 (for the record: that’s from 1996)
- And it has no symbol table
Maybe recreate its input?
The question at hand is now: is there something wrong with this ancient program, or is there something wrong with our environment?
After all, it’s been in use for years and years (right??).
Inspecting the binary is going to take some effort, so maybe the best approach is to make sure that the input files are correct.
Previously, we’ve run into problems with other programs like this thanks to subtle differences between shells or between gawk vs awk etc.
From the strace output for exec we can see the program didn’t actually take any arguments.
Right after the name of the program there’re square brackets indicating the arguments.
If I make up an argument like “asdf” and pass it to the program you can see it.
$strace -f -eexecve ~/ceph/Programs/netNglyc-1.0-broken/how/how98_Linux asdf

execve("/mnt/home/cchandler/ceph/Programs/netNglyc-1.0-broken/how/how98_Linux", ["/mnt/home/cchandler/ceph/Program"..., "asdf"], [/* 65 vars */]) = 0
It would be a fairly logical deduction to say that it must be reading from stdin.
Indeed, the strace output contains a read(0).
1560785 read(0,  <unfinished ...>
1560785 <... read resumed> "********************************"..., 4096) = 4096
On Linux, file descriptor 0 is always stdin3.
It’s starting to look like we’re not going to get out of digging through all the tsch and awk.
Secondly, that line of stars “*****” is actually a preview of the what the process read, and we can find a matching call above to write.
1560675 write(1, "********************************"..., 4096 <unfinished ...>
Yup. Here we have the file descriptor 1 which is always stdout.
Everything is being redirected via pipes.
Unfortunately, reconstructing the movement of data through pipes is extremely non-trivial.
Somewhere in the strace output we’re going to find some calls to open() which will reveal the paths to the specific files we’re looking for.
Double unfortunately, if they’re interleaved with chdir calls we might only have relative paths.
There’s also the problem of just a ton of data.
A quick run of strace tracking only open() calls yields thousands of results.
strace -f -eopen -o /tmp/opens ./netNglyc test/LEUK_RAT.fsa
*output omitted*

wc -l /tmp/opens
5489 /tmp/opens
Ugh.
Even if we filter out all the open calls to library files we’re still left with north of 2k results.
An alternate approach might be needed.
A break & a very surprising twist
Break time.
Time to switch gears and deal with a few other things.
How about making a copy of netNGlyc in my home directory so I can do some more analysis later.
Let’s give it a run to make sure the error is reproducible.
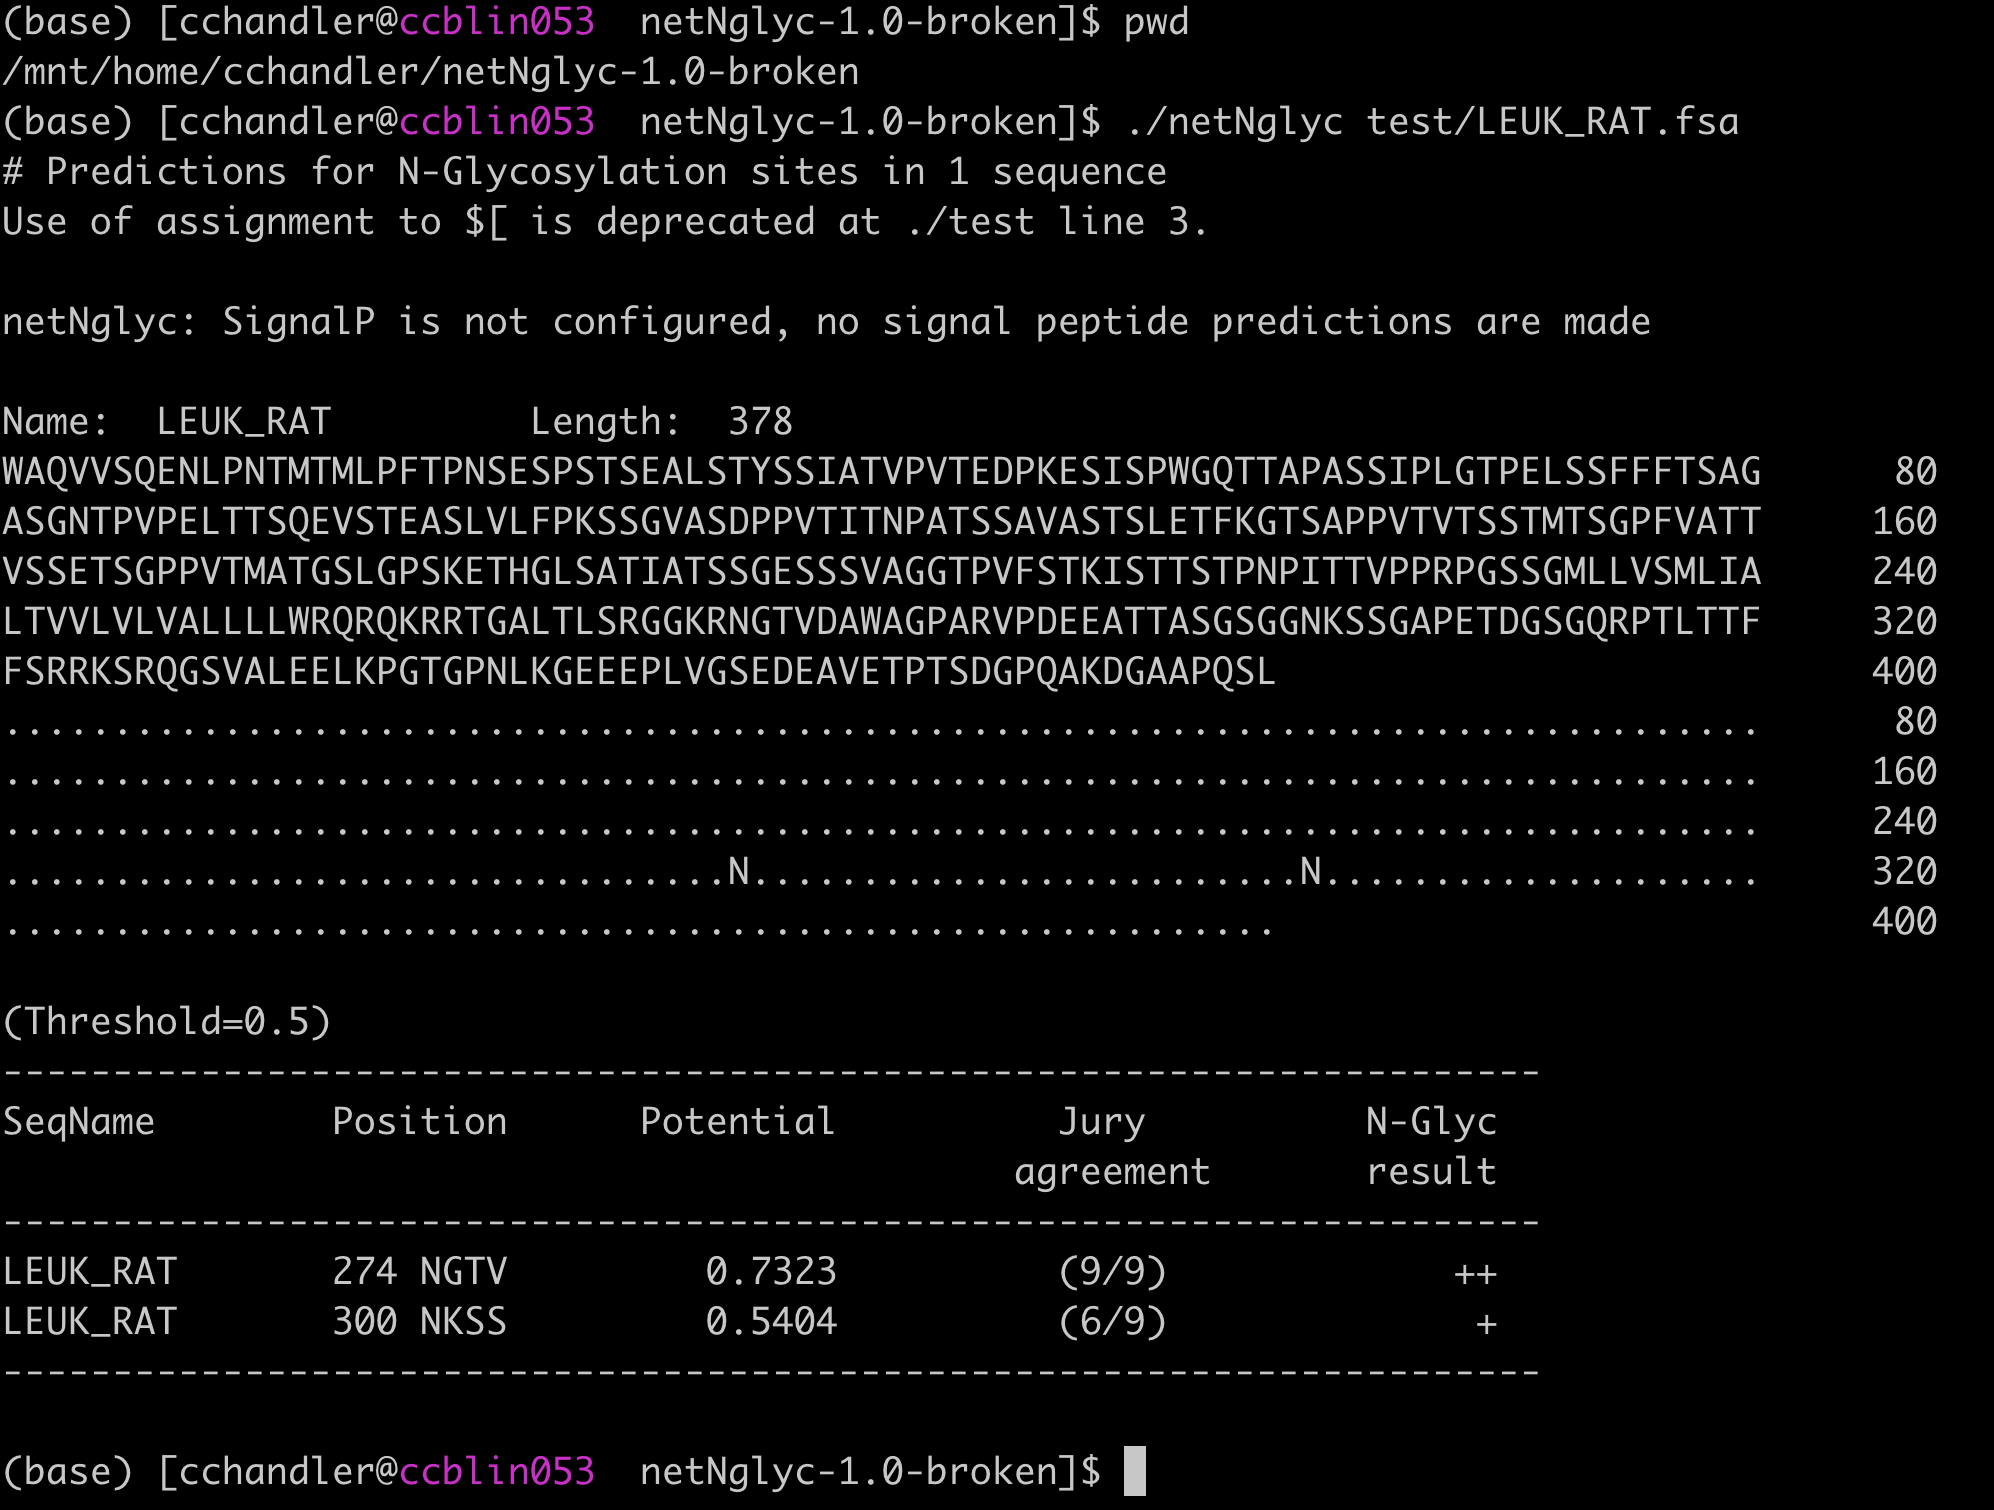 Excuse me?
Of course it ran correctly. No segfaults. No goofy messages.
Somehow, copying the files to my home directory fixes everything. No permissions were modified in the process. The only difference between the working copy and broken copy are which filesystem they’re running on4. It’s suddenly starting to appear that this segfault is somehow filesystem related.
But that’s nonsense. What could it possibly be doing that would interfere with the underlying filesystem?
Sleep & the inputs at last
The next morning.
Part of the problem with locating the errant inputs is that the netNGlyc script cleans up after itself.
It’s doing this via rm -rf on its temp directory.
Commenting that out we now have a tmp directory full of subdirectories.
We can combine our sequence of asterisks from the strace output with grep to finally locate the files in question.
$ grep -H '^\*\*\*\*' * | sort | uniq
how.test.dat:**************************************************************************
tmp.dat.1576058:**************************************************************************
tmp.dat.1576071:**************************************************************************
tmp.dat.1576086:**************************************************************************
tmp.dat.1576098:**************************************************************************
tmp.dat.1576110:**************************************************************************
tmp.dat.1576153:**************************************************************************
tmp.dat.1576192:**************************************************************************
tmp.dat.1576235:**************************************************************************
tmp.dat.1576258:**************************************************************************
The input files are all named something like tmp.dat.123456.
The trailing number in the filename (-H to grep) is likely the PID of the process that originally created it.
Let’s pipe one of these files to our friend how98_Linux.
$ ../../how/how98_Linux < tmp.dat.1576192
open: can't stat file
apparent state: unit 3 named test.how
lately reading sequential formatted external IO
Segmentation fault (core dumped)
Fantastic! We finally have a small chunk of iterable work that we can play with. The copy in my home directory works the same way, except of course that it outputs the correct result.
A hammer named GDB
Maybe there’s something we can learn from this binary.
Every time in my career that I’ve had to reach for strace and gdb to fix third-party code it has been a tale of woe.
This case is probably no different.
Remember that stripped symbol table?
Normally we could run where inside gdb and it would return all the frames on the stack.
(gdb) run < tmp.dat.1576058
Starting program: /mnt/ceph/users/cchandler/Programs/netNglyc-1.0-broken/tmp/netNglyc-1576032/../../how/how98_Linux < tmp.dat.1576058
open: can't stat file
apparent state: unit 3 named test.how
lately reading sequential formatted external IO

Program received signal SIGSEGV, Segmentation fault.
0x080744f7 in ?? ()
(gdb) where
#0  0x080744f7 in ?? ()
#1  0x080612e3 in ?? ()
#2  0x08061379 in ?? ()
#3  0x08064f3b in ?? ()
#4  0x08061999 in ?? ()
#5  0x08063e1b in ?? ()
#6  0x080643c3 in ?? ()
#7  0x08053c7a in ?? ()
#8  0x0804b68b in ?? ()
#9  0x08064e85 in ?? ()
#10 0x080690a6 in ?? ()
#11 0x08048111 in ?? ()
That’s why we wanted the symbol table.
gdb has no idea where we are.
Just a bunch of unnamed, unresolvable stack frames.
Maybe we can tackle this problem from another angle.
Instead of starting with the segfault and working backward, let’s try starting at the top and
addressing the open: can't stat file.
Let’s return to strace and have it look for only stat syscalls.
strace -f -estat ../../how/how98_Linux < tmp.dat.1576058
strace: [ Process PID=1787025 runs in 32 bit mode. ]
stat("test.how", 0xffd81afc)            = -1 EOVERFLOW (Value too large for defined data type)

*output omitted*
That is an interesting result.
We made a stat syscall and then the kernel returned EOVERFLOW.
It even helpfully responded with a message about the value being too large.
But there’s actually something else really weird about this stat call… and that is that it’s calling stat at all and not stat64.
stat64 has been the preferred call (and indeed the default in glibc) for this for nearly 20 years.
Even in 32-bit mode.
That means this binary was actually compiled before GCC/glibc started using the 64-bit call by default.
For completeness let’s check real quick.
GCC includes the version of the compiler in the .comment section of the ELF header.
And it’s easy enough to read the ELF header with objdump.
$ objdump -s --section .comment ../../how/how98_Linux | head

../../how/how98_Linux:     file format elf32-i386

Contents of section .comment:
 0000 00474343 3a202847 4e552920 322e3935  .GCC: (GNU) 2.95
 0010 2e322031 39393931 30323420 2872656c  .2 19991024 (rel
 0020 65617365 29000047 43433a20 28474e55  ease)..GCC: (GNU
 0030 2920322e 39352e32 20313939 39313032  ) 2.95.2 1999102
 0040 34202872 656c6561 73652900 00474343  4 (release)..GCC
 0050 3a202847 4e552920 322e3935 2e322031  : (GNU) 2.95.2 1
GCC 2.95.2 was released in October of 1999.
I don’t know the exact date for when GCC/glibc switched to using stat64 by default but I’m going to bet it was after 1999.
Things are starting to piece together.
I bet if we run the stat command5 ourselves we’ll find a value that this old 32-bit struct can’t handle.
 Ah ha
Ah ha
At last, this goofy bug is starting to make sense!
When the temp file is on the massive shared ceph filesystem it has an inode value the kernel can’t coerce into
32 bits.
When it’s in my home directory it just so happens to have a low enough inode value that the call to the 32-bit implementation of stat succeeds!
Despite my home directory also being on a 64 bit filesystem.
It’s purely a fluke.
Let’s download the source for kernel 3.10 (since we’re running CentOS 7.7) and do a quick verification.
This particular syscall handler is implemented in fs/stat.c.
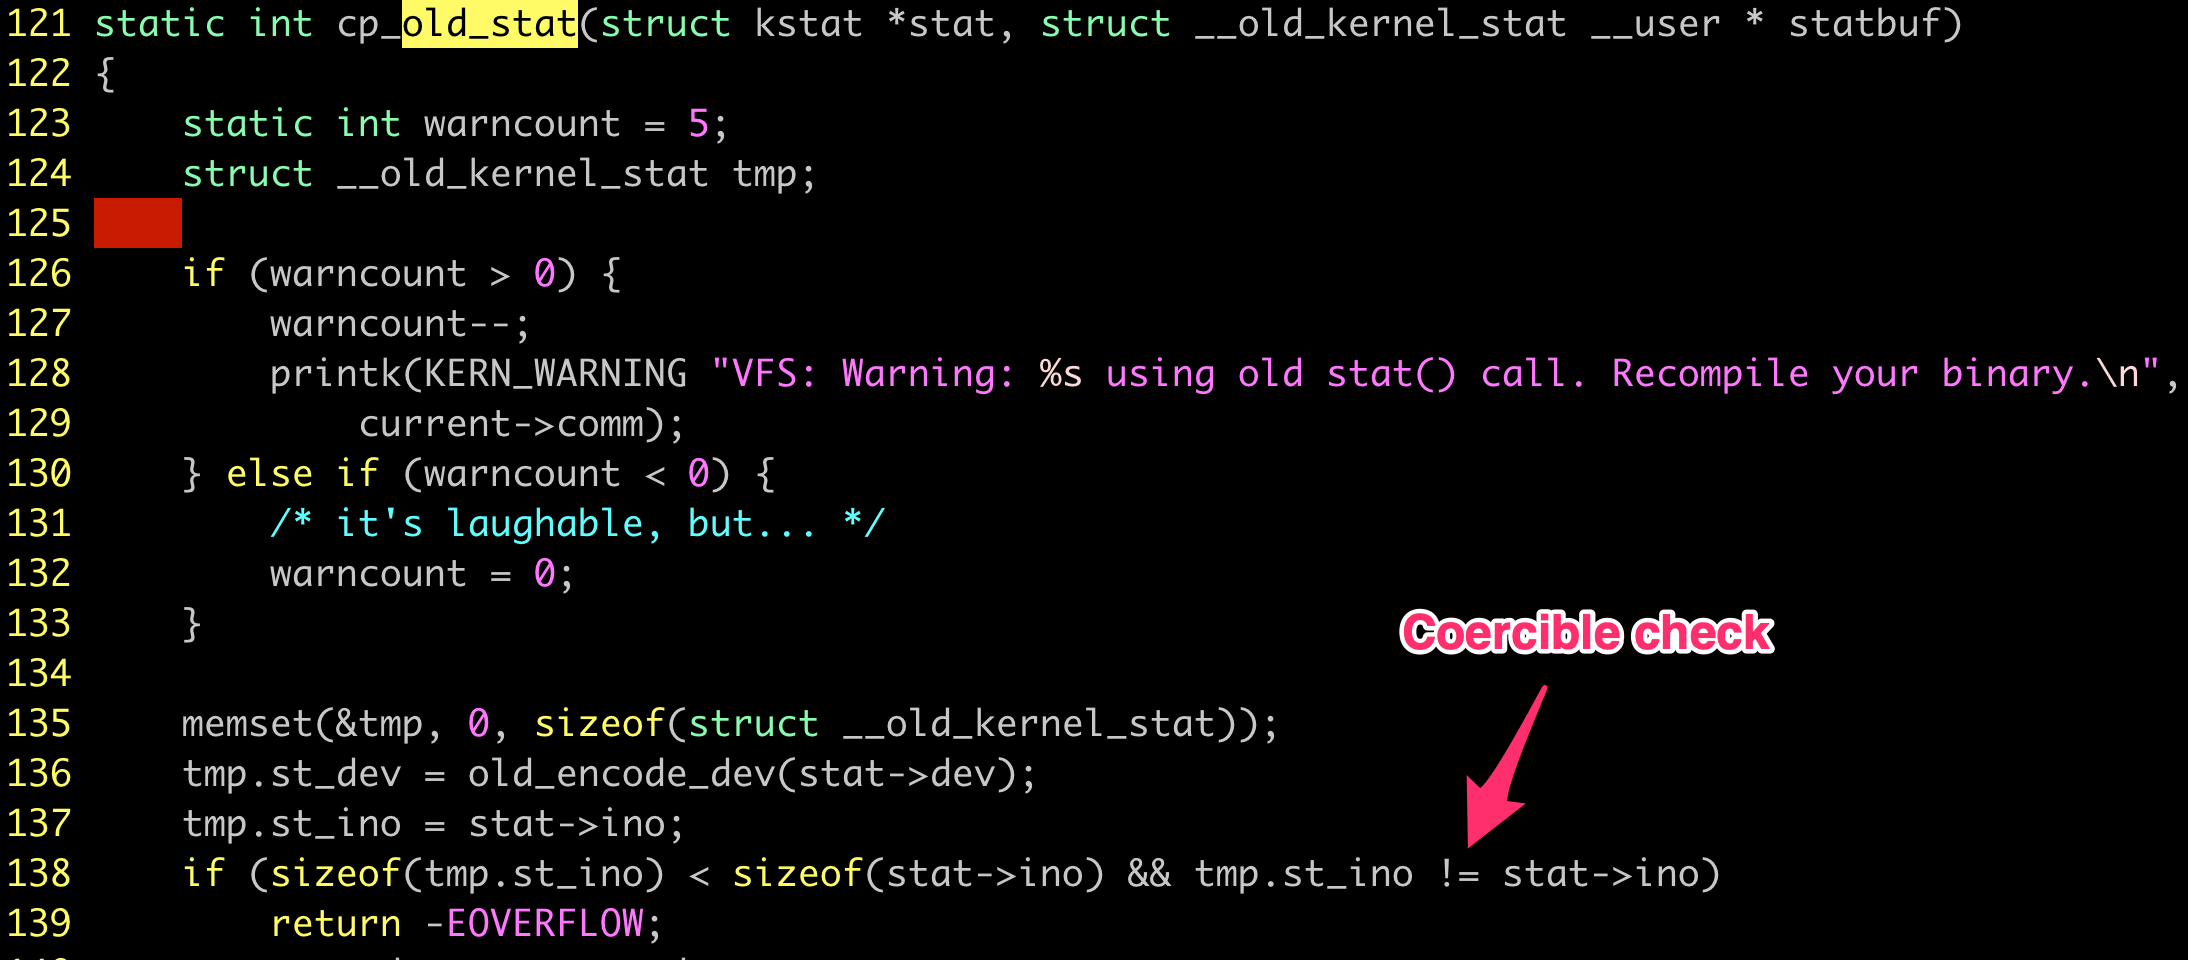 Will fail if inode size doesn’t match
The condition on line 138 of stat.c will only generate the EOVERFLOW if the types are different and if the integers don’t match.
So there’s the coercion check that lets it work in my home directory.
But what can we do about it?
At this point you would be totally forgiven for putting your hands up and saying “The copyright headers are from 1989. We have neither the source nor even symbols. The internet has long since forgotten how. Them’s the breaks.”
But this isn’t that kind of post and we aren’t on that kind of adventure.
There aren’t roads where we’re going
Let’s suppose for an instant that back in the early 90s (or even late 80s!) that we had to make different assumptions about the filesystem.
Maybe the original authors were checking the file exists via stat?
Today we’d almost certainly be using this call to check permissions, timestamps, or inode numbers…
But none of those have anything to do with the actual calculation we’re doing and we know the file exists.
What we do know is that there’s a call to stat and then it prints a message to the console about how it can’t stat the file.
Let’s try gdb again.
This time watching syscalls and the stack.
gdb has a very handy faculty for this with catch syscall where it will break anytime a particular syscall is made.
(gdb) catch syscall write
Catchpoint 1 (syscall 'write' [4])
(gdb) catch syscall stat
Catchpoint 2 (syscall 'stat' [106])
(gdb) run < tmp.dat.1576058
Starting program: /mnt/ceph/users/cchandler/Programs/netNglyc-1.0-broken/tmp/netNglyc-1576032/../../how/how98_Linux < tmp.dat.1576058

Catchpoint 2 (call to syscall stat), 0x080775be in ?? ()
(gdb) where
#0  0x080775be in ?? ()
#1  0x08064a88 in ?? ()
#2  0x08064385 in ?? ()
#3  0x08053c7a in ?? ()
#4  0x0804b68b in ?? ()
#5  0x08064e85 in ?? ()
#6  0x080690a6 in ?? ()
#7  0x08048111 in ?? ()
(gdb) c
Continuing.

Catchpoint 2 (returned from syscall stat), 0x080775be in ?? ()
(gdb) c
Continuing.

Catchpoint 1 (call to syscall write), 0x080779f4 in ?? ()
(gdb) where
#0  0x080779f4 in ?? ()
#1  0x0807136f in ?? ()
#2  0x08071be8 in ?? ()
#3  0x080853cf in ?? ()
#4  0x08081175 in ?? ()
#5  0x0806fc7a in ?? ()
#6  0x0806183c in ?? ()
#7  0x08063e1b in ?? ()
#8  0x080643c3 in ?? ()
#9  0x08053c7a in ?? ()
#10 0x0804b68b in ?? ()
#11 0x08064e85 in ?? ()
#12 0x080690a6 in ?? ()
#13 0x08048111 in ?? ()
(gdb)
What we’re interested in is the difference between these two sets of stackframes.
Frames 3-7 in the first set match frames 9-13 in the second.
So it’s reasonable to conclude that the frame with address 0x08053c7a is where the logic for checking the logical result of stat and associated calls is.
Thanks to the catch syscall stat we also know the stat call happens at 0x080775be.
We’re going to need some reverse engineering tools.
At this point I fire up Cutter which uses the Radare2 core.
Let’s run our binary through cutter and analyze the call graph + instructions.
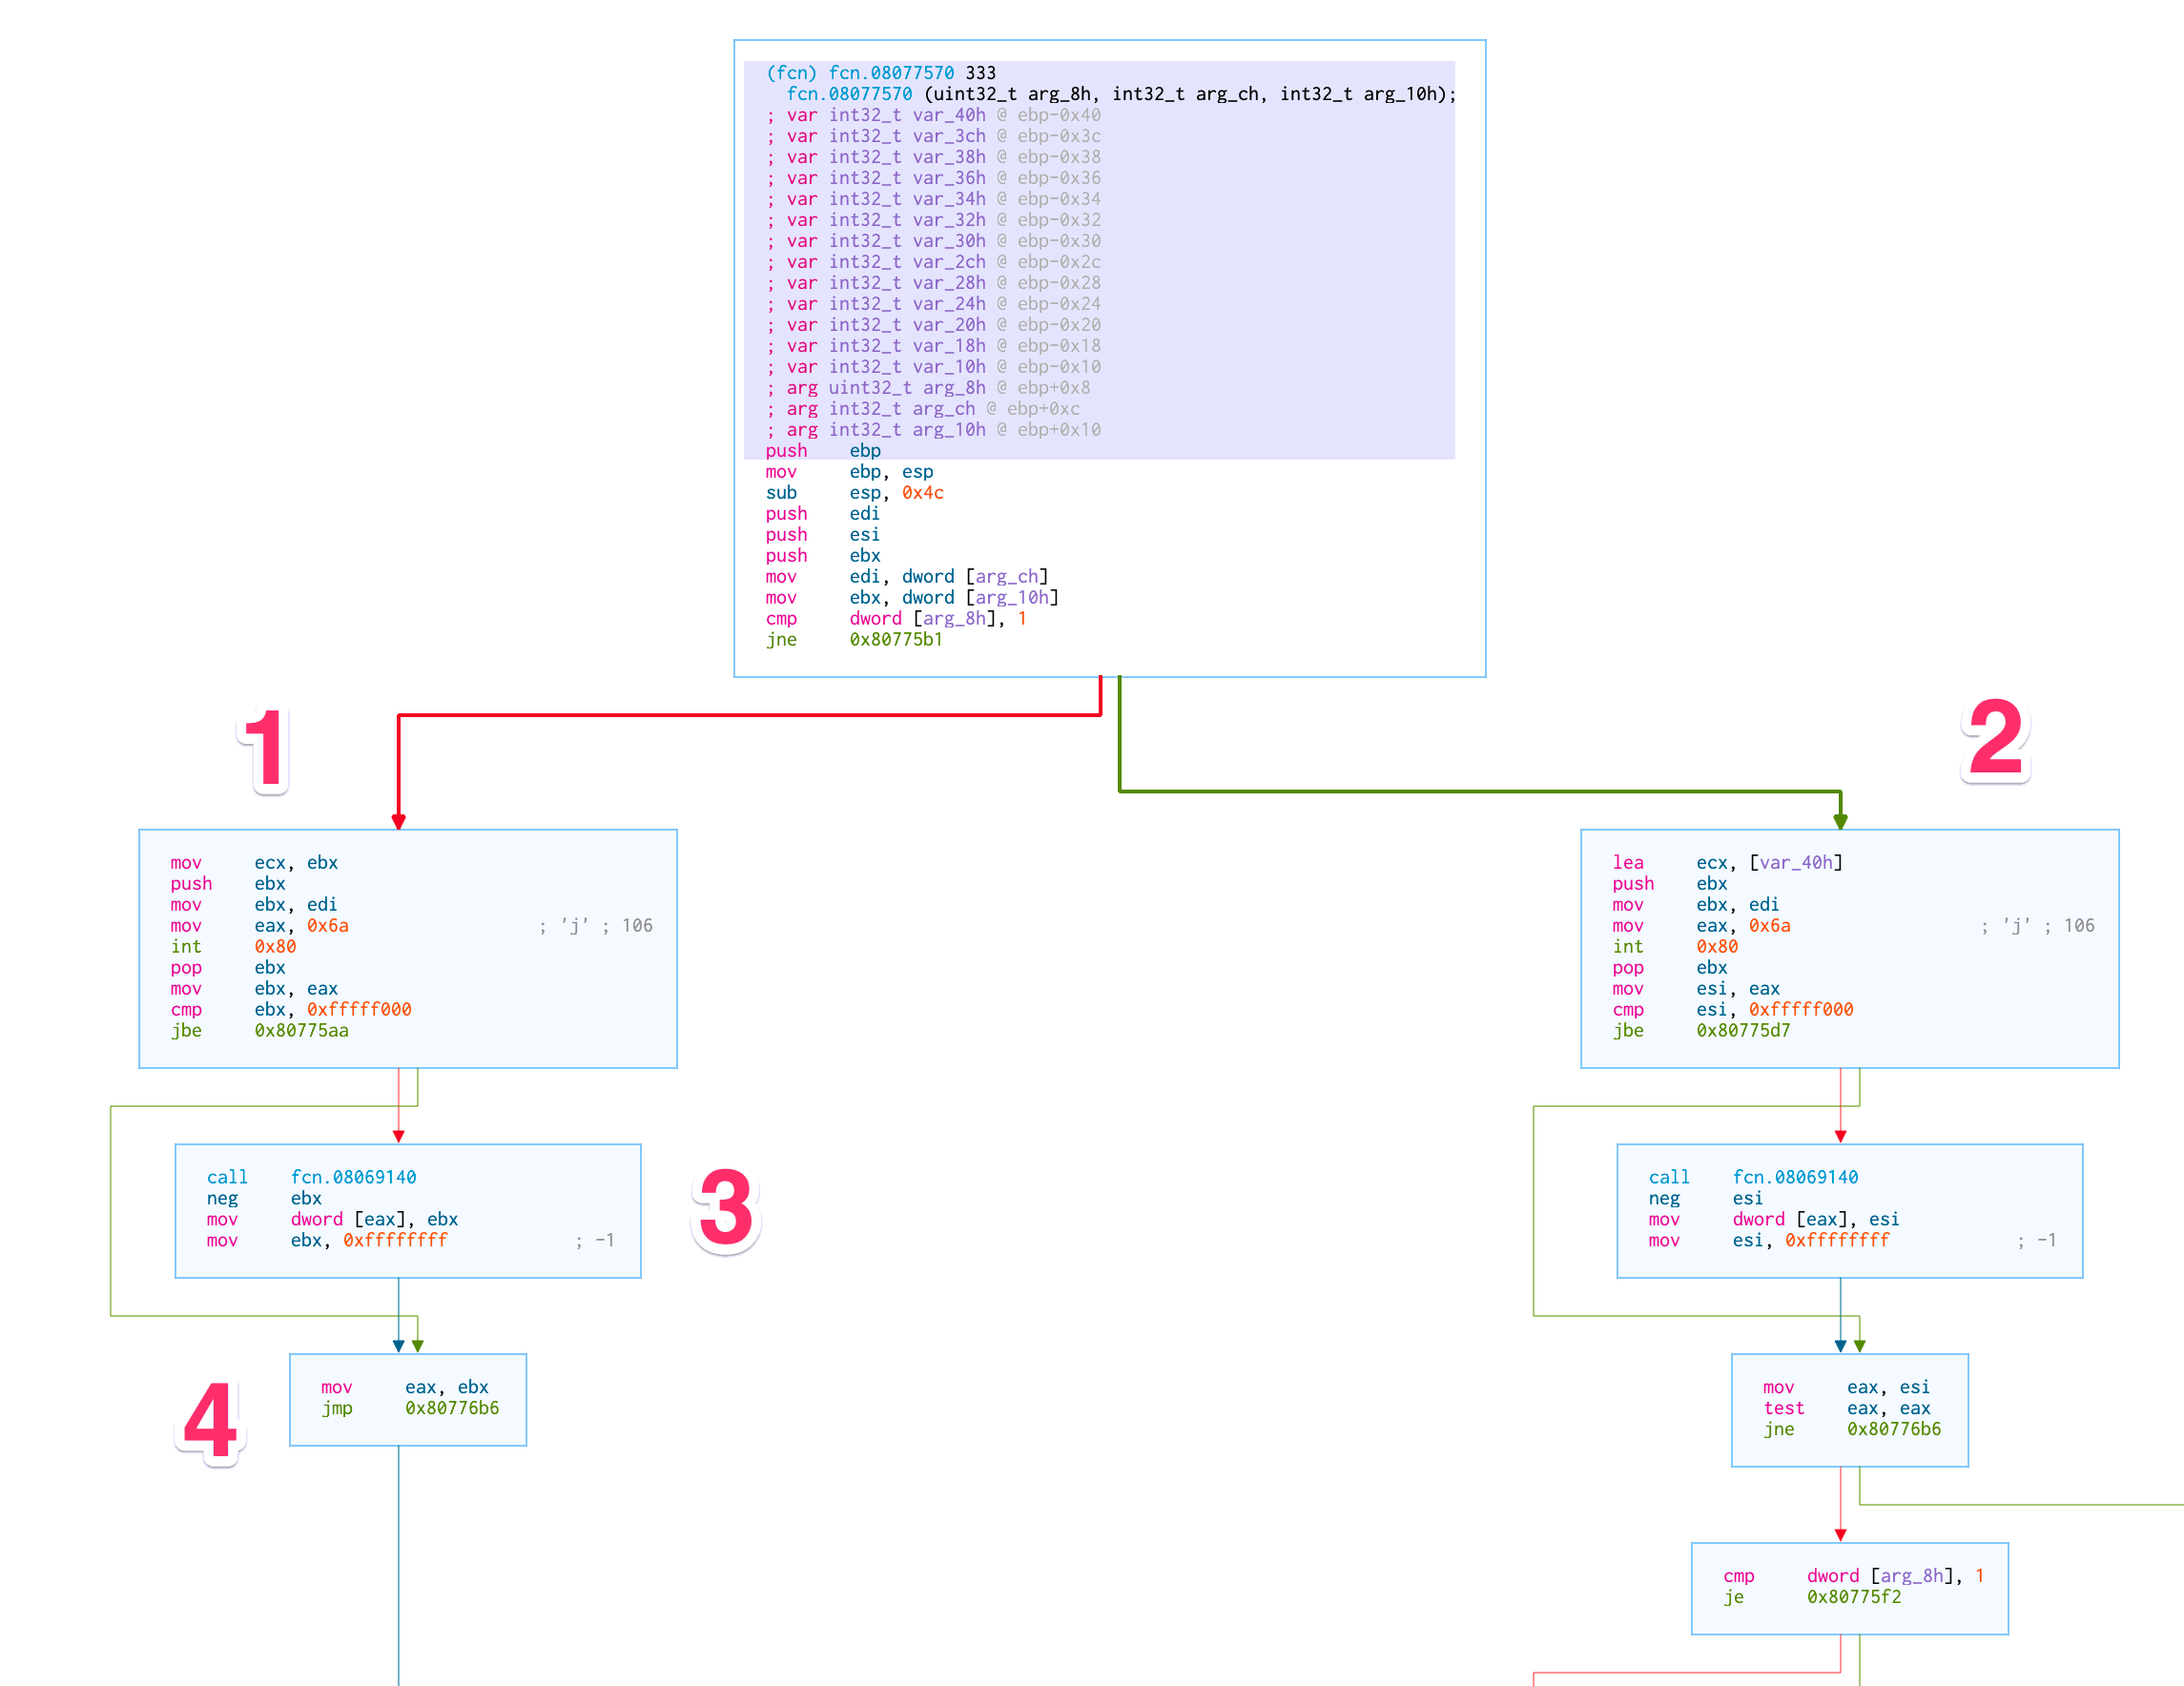 Really not fooling around anymore
Above is the function body that contains the stat at 0x080775be- you can see it in box #1.
If you aren’t used to reading x86 assembly it’s the int 0x806.
Box #2 also has a call to stat but we don’t take that path, so we’re going to ignore it.
What’s interesting though is that register $eax will have the return value of the syscall.
Assuming that it’s 0/successful we go straight to box #4.
And from #4 we return…
I didn’t have space in my screen grab, but after box #4 we just return.
It’s too early to say the program does absolutely nothing with the stat call, but it’s not doing anything fancy near the callsite.
Once we return from this particular frame we find a function that does actually save off a piece of the stat buffer.
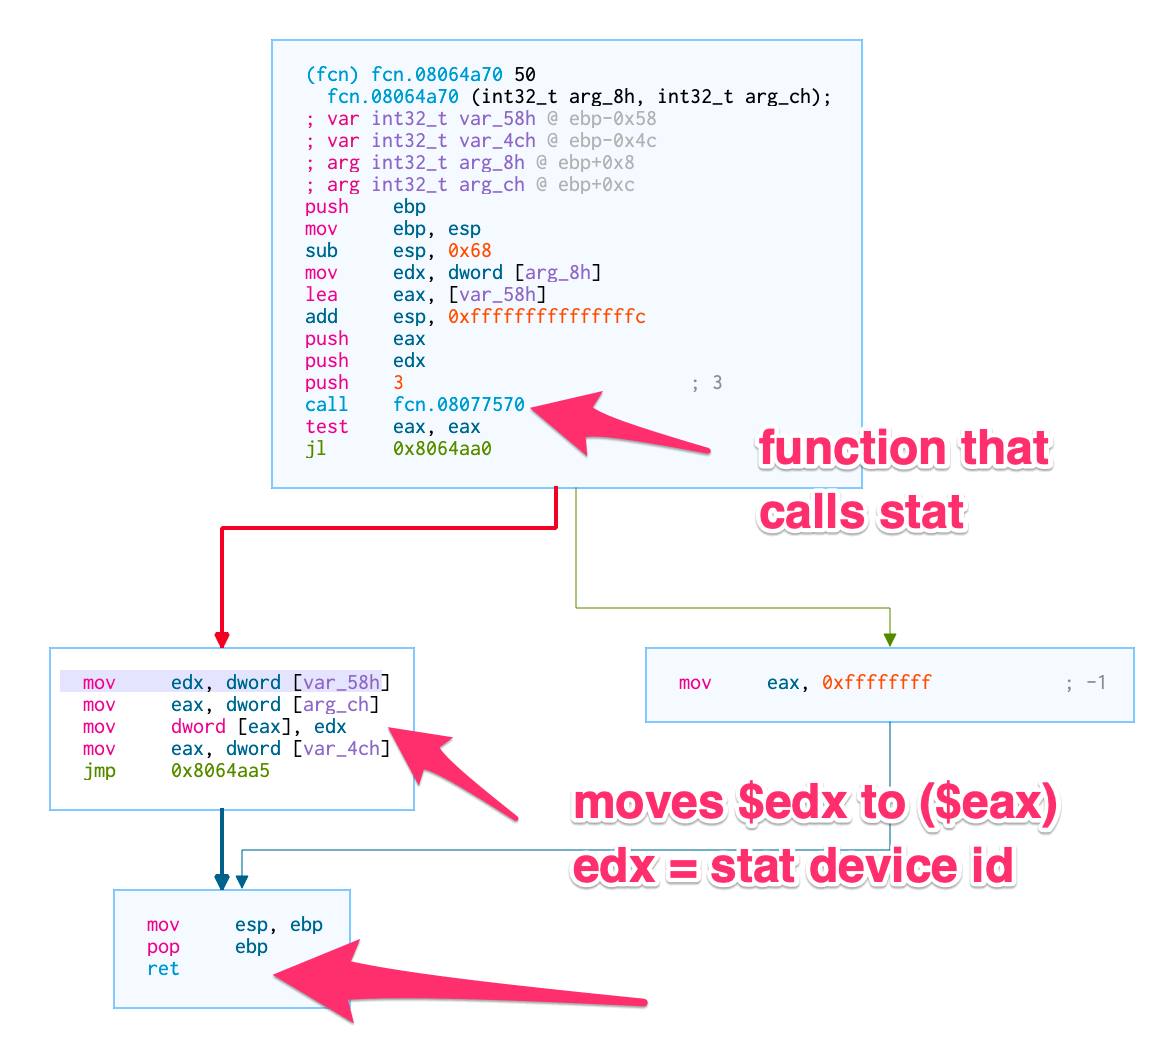 Does almost nothing with
 stat data
So… it would appear that the program calls stat on a file, gets the device id (and only the device id) from the stat buffer, saves it off into memory…
How do we know it’s just the device id?
Firstly, because it only moves a single dword (32 bits) which we can see in the instructions.
Secondly, because we can inspect the memory and see what’s in the stat struct directly.
$ gdb ../../how/how98_Linux
GNU gdb (GDB) Red Hat Enterprise Linux 7.6.1-115.el7
Copyright (C) 2013 Free Software Foundation, Inc.
License GPLv3+: GNU GPL version 3 or later <http://gnu.org/licenses/gpl.html>
This is free software: you are free to change and redistribute it.
There is NO WARRANTY, to the extent permitted by law.  Type "show copying"
and "show warranty" for details.
This GDB was configured as "x86_64-redhat-linux-gnu".
For bug reporting instructions, please see:
<http://www.gnu.org/software/gdb/bugs/>...
Reading symbols from /mnt/home/cchandler/netNglyc-1.0-broken/how/how98_Linux...(no debugging symbols found)...done.
(gdb) break *0x080775be
Breakpoint 1 at 0x80775be
(gdb) run < tmp.dat.1603546
Starting program: /mnt/home/cchandler/netNglyc-1.0-broken/tmp/netNglyc-1603521/../../how/how98_Linux < tmp.dat.1603546

Breakpoint 1, 0x080775be in ?? ()
(gdb) x/26xw $ecx
0xffffbc2c:	0x0000002c	0x03651d33	0x000181b4	0x06110611
0xffffbc3c:	0x00000000	0x0000038d	0x00100000	0x00000001
0xffffbc4c:	0x5f99ee5b	0x0a823368	0x5f99ee5b	0x0b051738
0xffffbc5c:	0x5f99ee5b	0x0b03e032	0x00000000	0x00000000
0xffffbc6c:	0xffffbcec	0x08064a88	0x00000003	0xffffbd3c
0xffffbc7c:	0xffffbc94	0x08061777	0x00000003	0x00000007
0xffffbc8c:	0xffffbca4	0x08070f47
The first byte contain 0x2c which matches the device field in /usr/include/bits/stat.h.
If we stat the file test.how (which is the first file it actually stats).
$ stat test.how
  File: ‘test.how’
  Size: 909       	Blocks: 1          IO Block: 1048576 regular file
Device: 2ch/44d	Inode: 56958259    Links: 1
Access: (0664/-rw-rw-r--)  Uid: ( 1553/cchandler)   Gid: ( 1553/cchandler)
Access: 2020-10-28 18:19:07.176305000 -0400
Modify: 2020-10-28 18:19:07.184883000 -0400
Change: 2020-10-28 18:19:07.184803378 -0400
We can see:
- the device as
2ch/44d(2cin hex and44in decimal) - the inode 56,958,259 decimal and
0x03651d33 - my uid/gid decimal 1533 and
0x0611hex
But either way, that’s the last we ever hear of it.
We can convince ourselves that this is the case by using gdb and setting an rwatch on that address once it’s set.
gdb will then trigger a hardware assisted breakpoint whenever that particular piece of memory is accessed.
If we get to the end of the program and get a result without triggering the breakpoint we know this memory/device id is never read.
(base) [cchandler@ccblin053  netNglyc-1603521]$ gdb ../../how/how98_Linux
GNU gdb (GDB) Red Hat Enterprise Linux 7.6.1-115.el7
Copyright (C) 2013 Free Software Foundation, Inc.
License GPLv3+: GNU GPL version 3 or later <http://gnu.org/licenses/gpl.html>
This is free software: you are free to change and redistribute it.
There is NO WARRANTY, to the extent permitted by law.  Type "show copying"
and "show warranty" for details.
This GDB was configured as "x86_64-redhat-linux-gnu".
For bug reporting instructions, please see:
<http://www.gnu.org/software/gdb/bugs/>...
Reading symbols from /mnt/home/cchandler/netNglyc-1.0-broken/how/how98_Linux...(no debugging symbols found)...done.
(gdb) break *0x08064a92
Breakpoint 1 at 0x8064a92
(gdb) run < tmp.dat.1603546
Starting program: /mnt/home/cchandler/netNglyc-1.0-broken/tmp/netNglyc-1603521/../../how/how98_Linux < tmp.dat.1603546

Breakpoint 1, 0x08064a92 in ?? ()
(gdb) p $eax
$1 = 175498268
(gdb) p/x $eax
$2 = 0xa75e41c
(gdb) rwatch *0xa75e41c
Hardware read watchpoint 2: *0xa75e41c
(gdb) c
Continuing.

## Bunch of output omitted

 T*SAMPLE*  LENGTH:      378  OK:     161  PRCENT:  42.593  ERROR:    124.46321
    DISTRIBUTION: N:       0       0   0.0     C:     378     161  42.6
    CORRELATION:  N: 0.0000   C: 0.0000
[Inferior 1 (process 1853441) exited normally]
(gdb)
And indeed, it’s never read again.
Do as I say, not as I do
We now have a potential strategy for fixing this bug.
It appears that it’s the error handling code that’s trying to deal with the failing stat call that actually ends up triggering the segfault.
So one possibility is that we modify the binary to ignore the result of stat.
We’ve verified that this little program doesn’t use the result from the stat-calling functions for any of our use-cases.
Let’s use radare2 again to inspect+modify the binary directly.
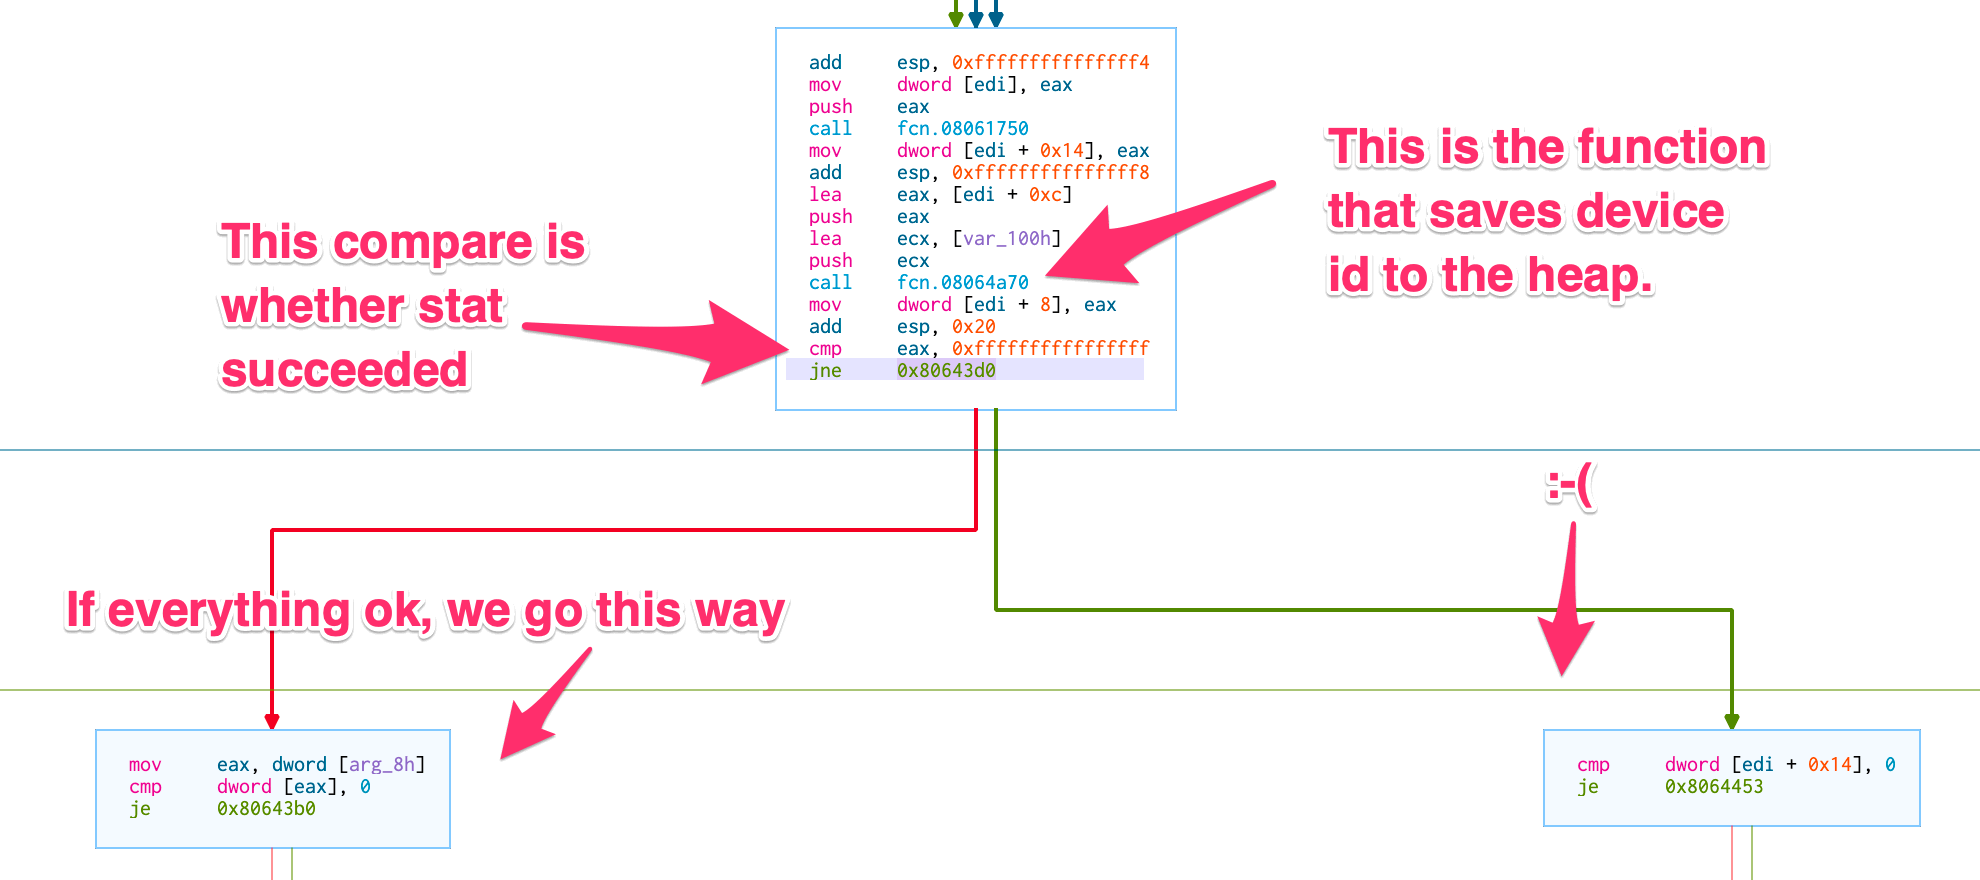 The comparison that changes everything
At 0x0806438e is the instruction jne or jump-not-equal.
You can see it at the bottom of the main box in the figure above.
If we change this from a jne to an unconditional jmp it will always take the left path and ignore the result from stat entirely.
We make the change…
Voila!
(base) [cchandler@ccblin053  netNglyc-1576032]$ pwd
/mnt/home/cchandler/ceph/Programs/netNglyc-1.0-broken/tmp/netNglyc-1576032
(base) [cchandler@ccblin053  netNglyc-1576032]$ ../../how/how98_Linux < tmp.dat.1576058


 ******************************************************************************
 ******************************************************************************
     NEURAL NETWORK MOLECULAR STRUCTURE PREDICTER *HOW*  (C) 1989-1995
 ******************************************************************************
 ******************************************************************************


 NETWORK ARCHITECTURE:  NETS =    1
                        LAYER 1:   171 CELLS
                        LAYER 2:     2 CELLS
                        LAYER 3:     2 CELLS

                        ICOVER:   -90 CELLS
And just like magic, it suddenly works as expected on the 64-bit filesystem!
We should talk about what just happened & epilogue
In the course of a normal day I would NOT recommend making binary edits to a program that’s old enough to drink. I do, however, believe in making an informed trade-off on time, effort, and balancing reward against risk. In this case, two days of debugging and a clever hack saved a team several weeks worth of work. We were also able to get to a place of (relative) emotional safety given the solution via testing. After several thousands of tests we’ve confirmed that the output remains the same despite our clever workaround.
Every once in a while, you really do get to fix a whole problem with a single instruction edit.
Footnotes
-
In the example I grep for the more general
execjust to be safe. Several additionalexecflavors exist. See the exec Wiki page. ↩ -
The symbol table has been completed removed. Even if we were to get a stack trace from this program it would be meaningless. Once upon a time this was done to make distributing files easier since the symbol table was proportionally large. ↩
-
See
man 3 stdin. ↩ -
For completeness: The original installation location is on a network distributed ceph install. My home directory is a GFS filesystem mounted via NFS. ↩
-
statis both a command and a syscall. You can check the difference withman 1 statvsman 2 stat. ↩ -
A longer explanation of this mechanism is available at Anatomy of system call, part 2. ↩
